Car testing’s first century has been a fascinating ride
Sports cars and supercars are faster and more capable than ever. A base C8 Corvette can bang off a 0–60 sprint in under 3 seconds, territory not long ago inhabited solely by six-figure exotics. The degree to which this performance is usable on the street is open for debate, but there’s no mistaking the fact that bragging rights still matter. And short of pitting cars head-to-head on a closed course, performance testing by the automotive media is still the best way for the public to compare cars by the numbers and validate automakers’ claims. In a century of this tradition, while the mission has remained the same, the methods and tools of the trade have transformed just as dramatically as the vehicles themselves.
Britain’s Autocar began clocking performance in the 1920s, at a time before most cars could run a mile in a minute. Nonetheless, 0–60 mph acceleration was the performance staple that early car enthusiasts enjoyed deliberating over a pint. Or three.
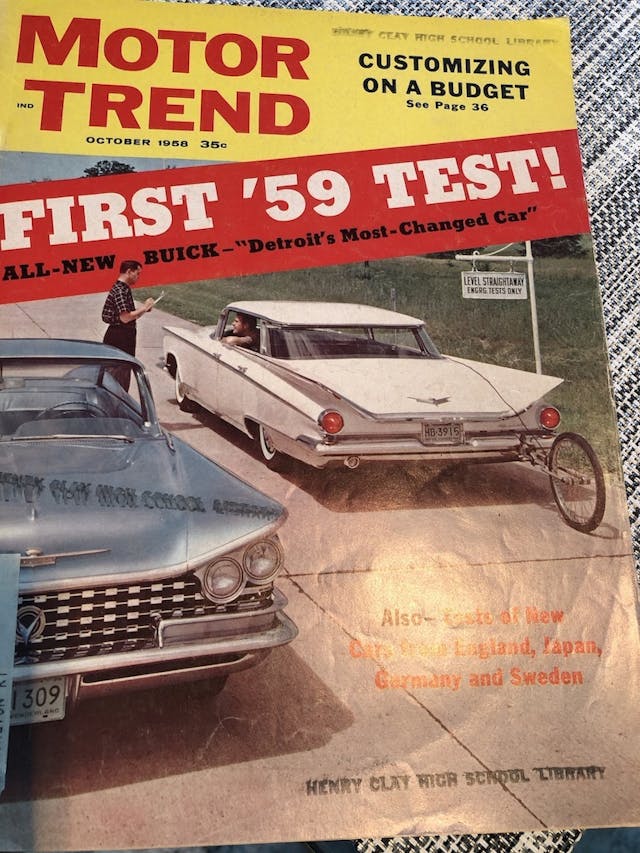
In 1947, Road & Track waved the green flag on car enthusiasm in America. Hot Rod chimed in for 1948, with Motor Trend following suit in 1949 and Sports Cars Illustrated in 1955. SCI changed its stripes to Car and Driver in 1961.
Mystery meter
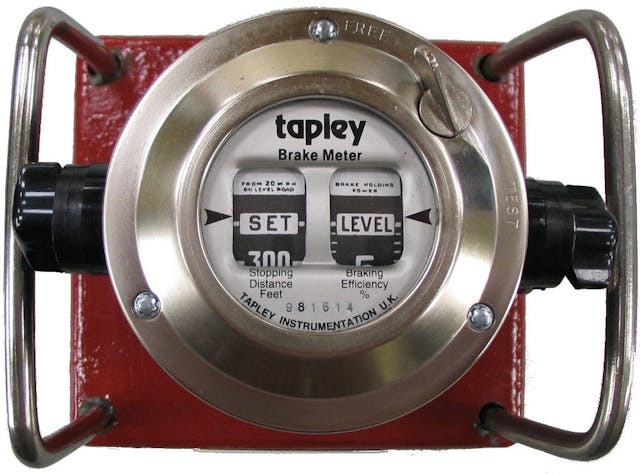
An odd British import was the Tapley Meter which R&T used to measure and report data labeled “lb/ton @ mph.” Long-time staffer Dennis Simanaitis, acknowledging that he wasn’t sure exactly what this information meant, has at least revealed that the device was a pendulum-driven accelerometer. Most likely it was R&T’s attempt to quantify deceleration during coasting and braking from various speeds.
The stopwatch era
Hand-timed acceleration tests on straight sections of public road were the early norm. C/D, for example, used a remote section of the Jones Beach Causeway on Long Island. Key distances were tape-measured and marked with reflectors unlikely to draw law-enforcement eyes. In 1959, editor Karl Ludvigsen began using a special stopwatch purchased in Germany which deposited a tiny dot of liquid on the clock face each time a button was pressed, enabling accurate time-to-speed measurements.
Advanced testing technology
Inspired by equipment in use by domestic car manufacturers, Motor Trend and R&T began using “fifth wheels” strapped to the test car’s rear bumper to obtain speed readings. The only real benefit was less speedometer error; an onboard observer was required to click the bank of stop watches indicating time-to-speed increments.
Against the drag-strip clock
C/D’s Patrick Bedard refused to impede a test car’s acceleration with the weight of a stopwatch-clicking assistant. His late-1960s strategy instead employed drag-strip timing gear in combination with a technique called graphical integration. Quarter-mile speed and elapsed-time data were used to plot a trial speed-versus-time curve on a sheet of graph paper. The curve’s shape was then adjusted until the area beneath the curve exactly matched a quarter-mile.
Weather corrections
R&T and MT conducted their tests on the West Coast where good weather was the norm. C/D, on the other hand, had to contend with East Coast winters that wreaked havoc on acceleration reporting consistency. Luckily, Chrysler’s drag race team had created an elaborate chart of weather correction factors they had determined by logging how a given racer’s performance deviated with changes in air temperature and barometric pressure. After Hot Rod magazine published the chart, C/D began using it to improve the consistency of its acceleration test data.
Microprocessors arrive
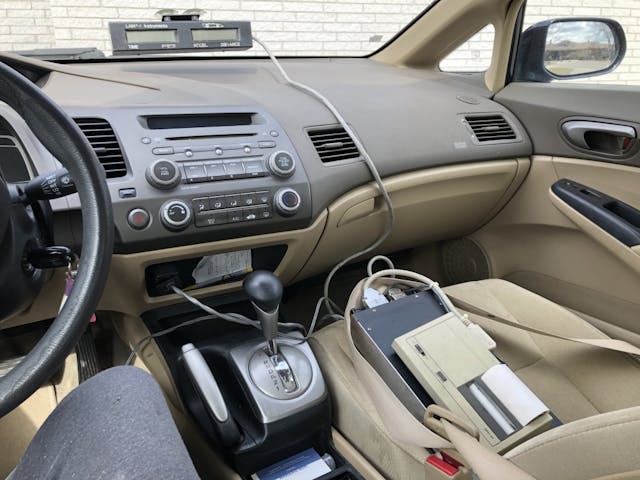
In the mid-1970s, physics genius Paul Lamar invented the modern fifth wheel. His first design recorded distance pulses on a cassette tape for playback through a strip chart recorder which plotted an accurate speed-versus-time trace. Adding a microprocessor facilitated real-time measurements with the pertinent data automatically printed at the end of each test run. Acceleration, passing, and braking test formats were held in memory and a dash-top display kept the driver in the info loop.
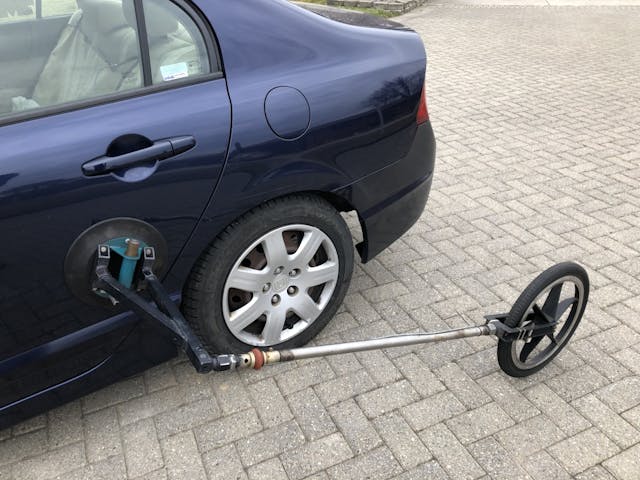
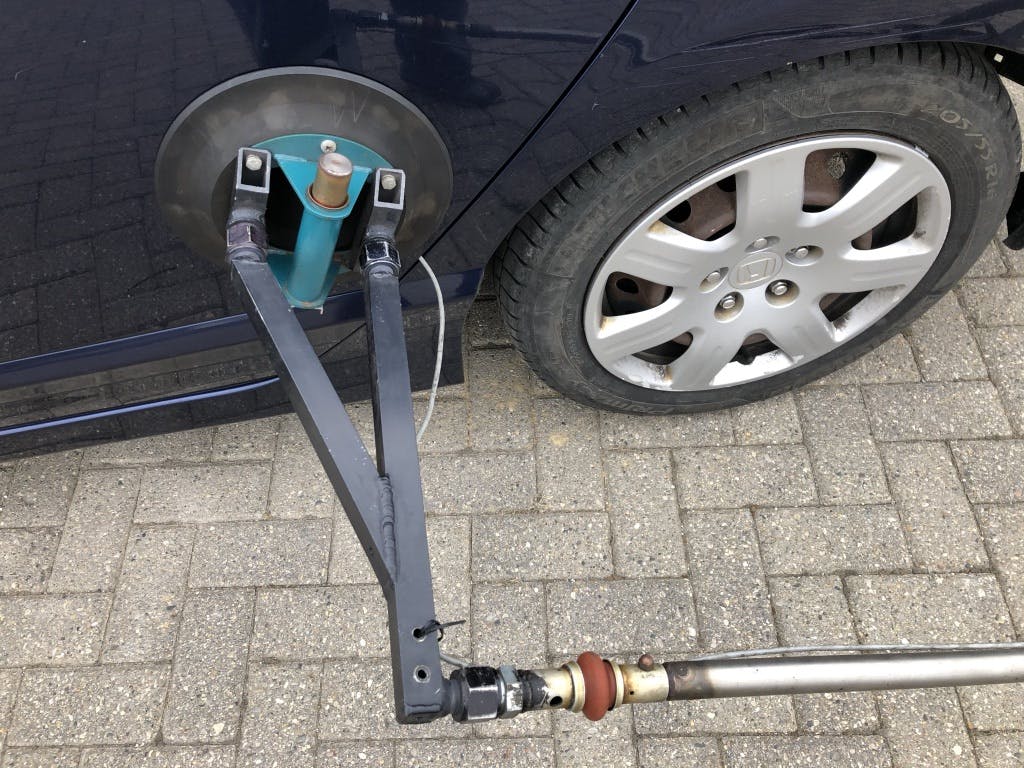
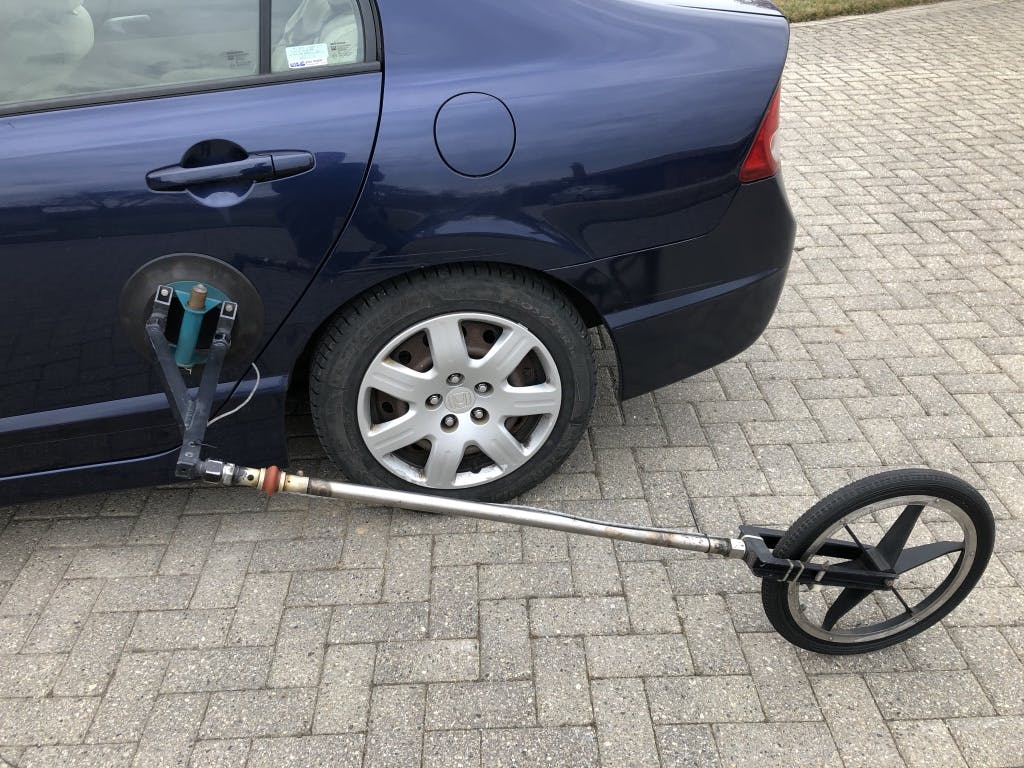
C/D took this opportunity to improve the Lamar fifth wheel’s mechanical design. Relocating attachment from the rear bumper to the side of the vehicle kept the test equipment visible in the driver’s rear view mirror. A large suction cup secured the wheel to the car. A gas-pressure damper originally intended for lifting tailgates kept the 16-inch tire in touch with the pavement over bumps. While this arrangement may seem sketchy, C/D’s fifth wheel did once endure a 180-mph ride while attached to a Le Mans-winning Kremer Porsche.
Breaking the fifth wheel habit
In the late 1980s, a German-made Correvit device rendered ground-contact test equipment obsolete. Also mounted to the side of the vehicle, this electronic gear consisted of a light source that illuminated a spot of pavement near the car and a scanning device that “watched” that spot blur while the vehicle was underway. A microprocessor in the car converted the optic signal to performance data. The Correvit equipment was so sensitive that it even worked on wet pavement.
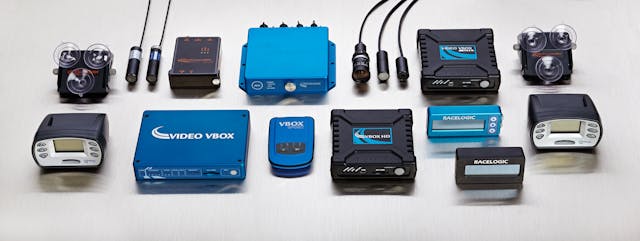
In 1992, British car enthusiast and inventor Julian Thomas began bending GPS technology to his will for car testing at the Racelogic enterprise he founded. Roof-mounted sensors communicating with satellites signaled an onboard processing unit. The best part of Thomas’s gear was its expeditious analysis that yielded accurate acceleration and braking measurements in just a few passes. In 2000, the U.S. government helped out by descrambling the GPS signals available for civilian use, thereby improving accuracy by a factor of 33. Racelogic’s VBox quickly became the preferred means of testing for both magazines and car manufacturers the world over.
Early handling tests
In the 1950s, a traffic circle located near Ludvigsen’s residence was used to examine cornering characteristics. Instead of whizzing around that bend with the tires howling, the driver merely recorded the degrees of steering lock required to keep the car tracking the roundabout as speed was gradually increased. Called “Steering Behavior” on C/D’s test results page, this was a readily understood measurement of understeer.
A decade or two later, car magazines hammered test cars around a painted circle while an observer clocked the time required for each full lap with a stop watch. A simple calculation yielded adhesion-limit cornering g.
MT’s Kim Reynolds advanced that state of the art with a procedure that required neither an observer nor the driver removing hands from the steering wheel to punch a stop watch. Instead, Reynolds carried the timer in his mouth; then, at the proper instant, he bit down on the stop button to register the time required to complete a lap of the pad.
Fellow MT tester Ron Grable noticed that left turning was invariably the quicker way around the pad because of the driver’s location in the car. Since the underlying goal was topping the competition’s test numbers, MT simply dropped right turning from their agenda. That saved time, tire tread, and stop-watch bite marks.
A variety of courses defined by traffic cones have been used over the years to quantify maneuverability. In the 1980s, C/D replaced the evenly spaced line of cones approach with an uneven array requiring 500 feet of deceleration followed by 500 feet of acceleration. Double lane-change maneuvers simulating a real-world evasive maneuver have also proven useful.
Stopping distance
When brake testing began in the ’60s, an electrical contact attached to the brake pedal fired an explosive charge which shot a splotch of paint onto the road to indicate the beginning of each deceleration test. A tape measure from that mark to the test car revealed braking distance.
The proving grounds era
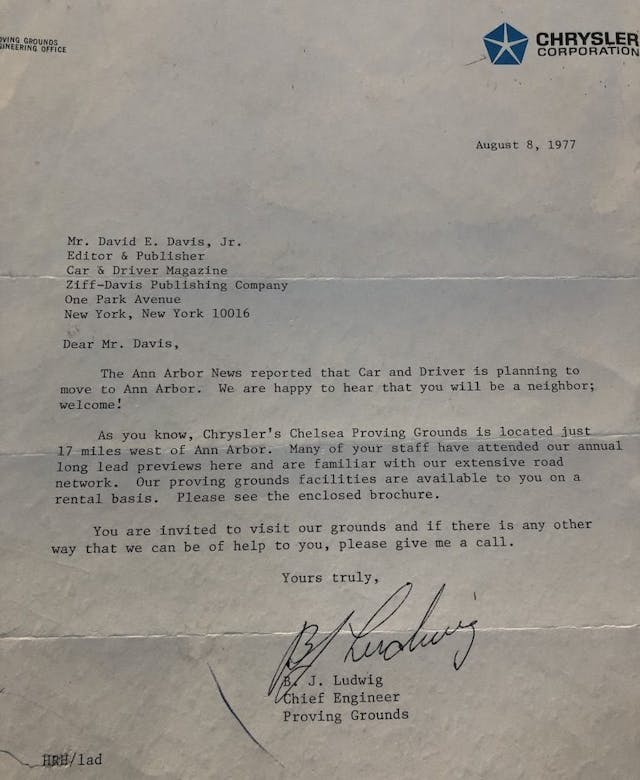
In 1977, when C/D’s move from New York to Ann Arbor, Michigan was reported in The Ann Arbor News, the chief engineer at Chrysler’s nearby proving grounds graciously invited the magazine to rent access to his facilities for car testing. This godsend greatly advanced the scope and accuracy of all subsequent C/D performance measurements. Using a dead level “black lake” facility allowed cornering adhesion measurements at speeds closer to those seen in the real world. Two long straightaways were handy for safely reaching the top speed of most test cars. Precisely calibrated scales took the guesswork out of weight measurements.
In 2000, C/D discovered that tragedy could occur even during the most carefully controlled proving grounds conditions. Tech editor Don Schroeder perished due to a crash during his top-speed test of a RENNtech-modified Mercedes-Benz at a Texas track owned by Bridgestone. While the exact cause was never revealed, the suspicion was failure of a brake system component. C/D reacted by ceasing high-speed tests of cars modified by tuners.
Public road exploitations
Around 1980, in the teeth of the second energy crisis, C/D dispatched a letter to a Michigan official requesting access to a nearby freeway not yet open to traffic for fuel economy testing. To the editor’s everlasting chagrin, this request was granted and M-14 became the go-to location for all manner of “special” tests far beyond mpg measurements.
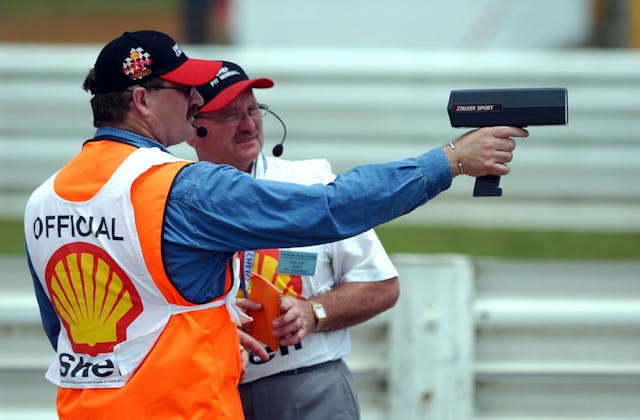
One of the more interesting examinations was the maximum distance for a police radar gun to register the velocity of an oncoming speeder. One finding was that a Corvette’s fiberglass body and tipped-back radiator made it more difficult to clock with radar than conventional cars. C/D also measured how readily a radar gun shifted its mph reading from a semi-truck onto a car passing the truck at felonious velocity.
Mrs. Orcutt’s driveway was another creative use of a public—make that semi-public—highway in the ’70s and ’80s. Located 100 miles northeast of Los Angeles, this 4.1-mile stretch was built in the late 1960s to preserve a widow’s access to her property after the I-40 interstate was constructed. The fact that this road was rarely used and that it crossed a dry lakebed made it perfect for high-speed measurements. C/D tester Csaba Csere reached 204 mph here in a Pontiac Trans Am concocted by Gale Banks, consuming only a couple of engines in the process. Today, the unmaintained pavement is too rough for such exploits, though magazines still visit the site for old time’s sake and to take spectacular comparison test photos.
Fuel economy measurements
Logbooks have long recorded fuel additions to magazine test cars during their evaluation stints. In the grip of the first energy crisis, C/D collaborated with the EPA to conduct fuel-economy measurements indoors on a chassis dynamometer using its own city and highway driving cycles.
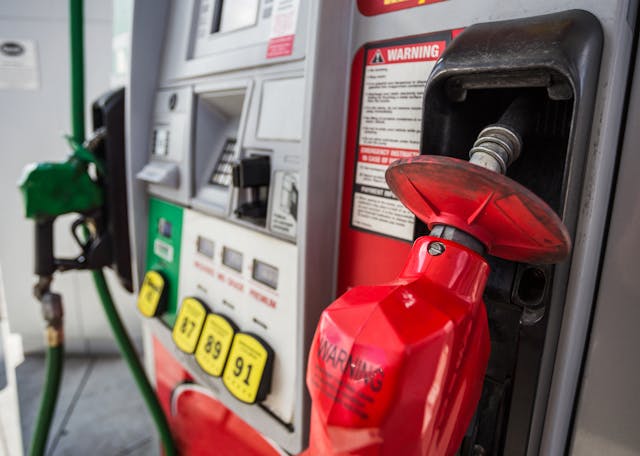
After 2010, C/D began conducting highway mileage measurements on a stretch of interstate near its Michigan office. In addition to cruising at a true 75 mph for 200 miles, testers methodically fill their tanks at the same gas pump, using a particular number of nozzle clicks to achieve consistent mpg results.
Practical matters
In the 1970s, most magazines added interior noise measurements obtained with precision sound-level meters. This helped distinguish annoying tire and wind noise from the more endearing motor music heard during full-throttle acceleration.
One procedural change at C/D is subtracting 0.2-second—what’s known as “rollout”—from acceleration figures. This well-meaning adjustment is aimed at correlating printed results with what a reader might measure at a drag strip. Unfortunately, it mainly causes confusion because few car enthusiasts grasp the subtleties associated with drag racing.
Creative coast down measures
In the 1960s, R&T supplemented its acceleration curve plot with a descending line revealing how quickly the test car shed velocity coasting in neutral from 80 mph.
After the EPA began conducting coast-down measurements in the 1970s to allow simulating real-world conditions on chassis dynamometers located indoors, C/D created its own version of that procedure. Analysis of the data so obtained allowed splitting drag into two categories: The first was the number of pounds of force corresponding to driveline friction and tire rolling losses. The second was aero drag, which increased with the square of velocity. Added together, these measurements allowed staffers to distinguish efficiently designed cars from road slugs. For example, a 1982 Lincoln Town Car consumed 19 horsepower cruising at 50 mph; a Toyota Starlet, only 11 hp.
C/D’s coast-down procedure also allowed determining aerodynamic drag coefficients without a wind tunnel. First, frontal area was determined by measuring the car’s maximum cross-section in a photo taken with a telephoto-lens camera. (A carefully placed yardstick provided scale.) Plugging frontal area and aerodynamic drag data into a simple equation yielded the test vehicle’s drag coefficient, which was handy for cross-checking figures touted by manufacturers.
Regrettably, most of the creative test procedures invented by buff books over the ages have gone the way of the Tapley meter. The next generation of testing will likely focus on obtaining the truth behind various claims made by manufacturers of electric vehicles. While most outlets do some basic range testing now, there is plenty of room to add precision in the way we measure battery storage, power draw, and efficiency. Could this result in some strange and esoteric machinery to give the old Tapley a run for its money? Let’s hope so.

